Custom simulated nodes requires our CANopen source code: Micro CANopen Plus, available separately. For hand-held CANopen diagnostics see our CANopen diag tool.
Buy CANopen Magic
CANopen Magic is available from the following vendors, which also sell suitable CAN interfaces.
North America
Embedded Systems Academy, Inc., California, USA- Online credit card sales: The CANopen Store USA
- Purchase order sales: Please contact us
Grid Connect, Inc., Illinois, USA
Europe
Embedded Systems Academy, GmbH, Germany- Online sales: EmSA Online Shop
- Purchase order sales: Please contact us
Tour
The following screenshots give you a taste of the functionality found in CANopen Magic. To see everything give it a try today.
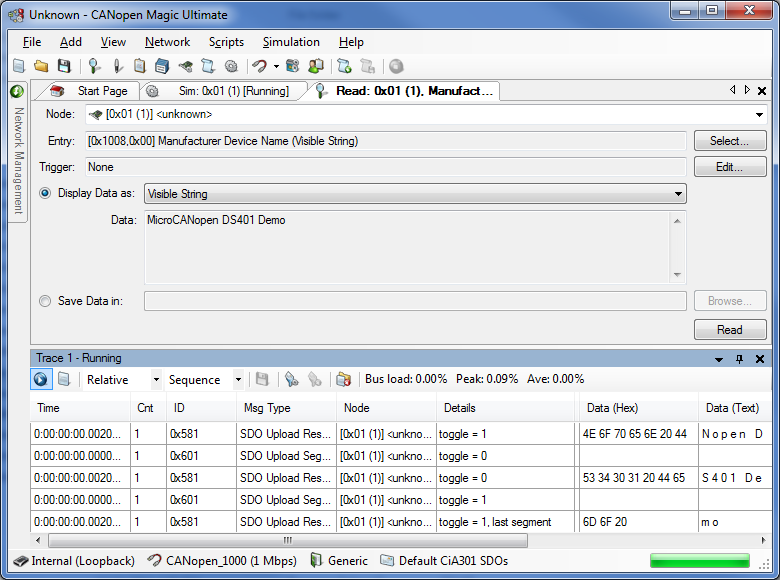
SDO Reads
Read from nodes using expedited, segmented and block SDOs

SDO Writes
Write to nodes using expedited, segmented and block SDOs in a variety of user-friendly formats

Connect to a CAN Bus
Connect to a CAN bus using a variety of supported interfaces. Switch interfaces and bus speeds on the fly

Object Dictionary
Quick and easy object dictionary entry selection. This can be customized by specifying your EDS files

Customized Window Layouts
The window allows highly flexible layout customization. Set it up for you and your project needs!
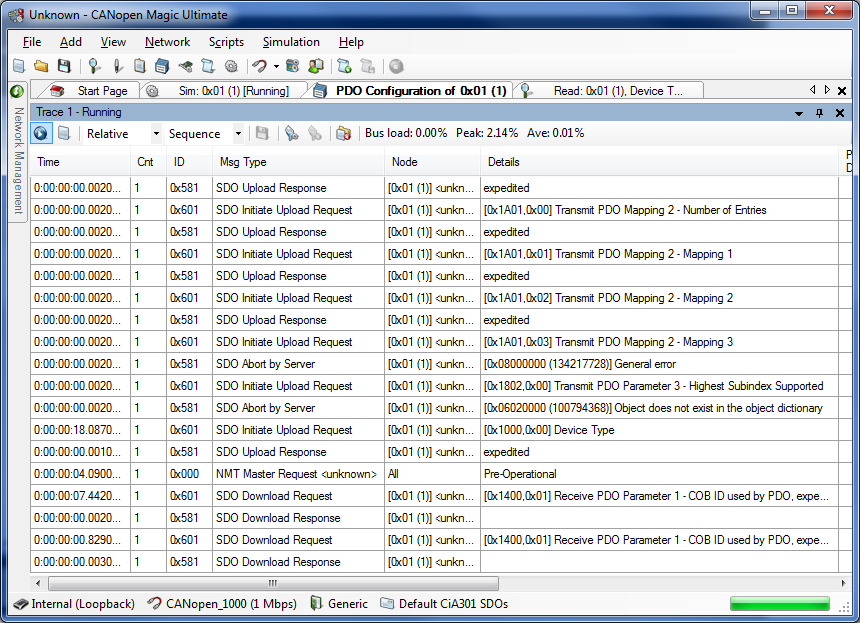
Trace Recording
CANopen message interpretation and accurate timestamps. Flexible filtering and configuration options

Trace Filtering
Flexible three-stage trace filtering with Python script support for complex scenarios

PDO Configuration
Read and configure PDOs. View the PDOs of multiple nodes at the same time for easy data mapping
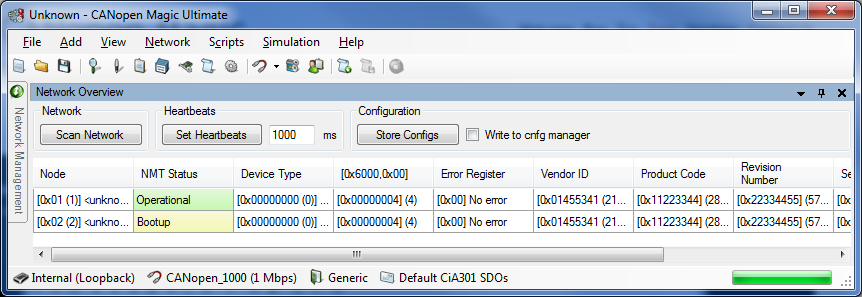
Network Overview
Create an overview of all nodes on the network with dynamic NMT status

Network Management
Send network management (NMT) messages to one or all nodes

Transmit CAN Messages
Transmit custom CAN messages with flexible triggering options

Process Data
Associate real time data on the CANopen network with meters and graphs for visualization

Simulate Nodes
Using our CANopen stack (available separately) create custom simulation nodes and visualize the object dictionary in real time

Define Real-Time Data
Define real time data that appears on the network then see it in the trace window or visualize using meters and graphs
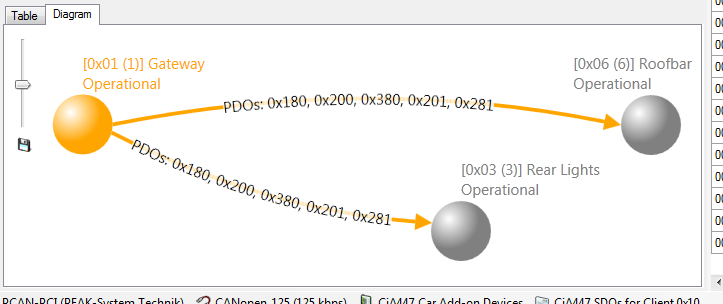
Network diagrams
With a single click the network is scanned and diagrams showing the PDO data relationships between nodes are constructed

CAN Messages
Create logical groups of CAN messages and transmit them sequentially

Trace Analysis
Analyse bus load and types of messages
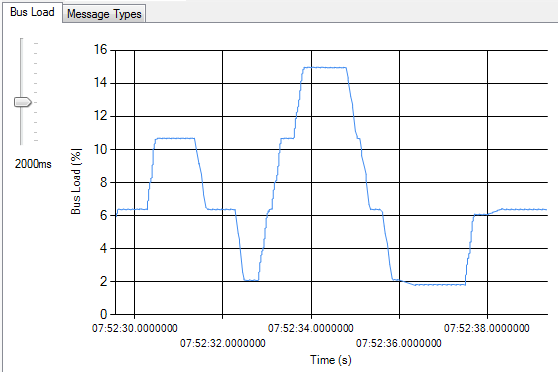
Trace Analysis
Analyse bus load and types of messages

CANopen FD Trace Display
The new trace display has a flags column that indicates if FD and bit
rate switching was used. All content of the Universal Service Data
Objects (SDOS) is displayed symbolically.
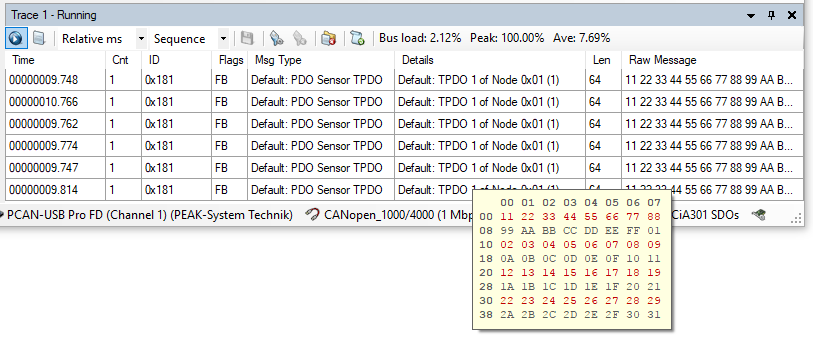
CANopen FD Trace Pop-Up
As messages can now contain up to 64 bytes, pop up windows are used to
display the entire raw data of a message.

CAN FD message transmit
When transmitting a CAN message, one can manually select if FD mode
and bit rate switch shall be used when transmitting an individual
message.
Copyright © 2002-2025 Embedded Systems Academy | All Rights Reserved | CANopen® is a trademark of the CAN in Automation User's Group


